Outdoor Program Trends in Central Oregon
Warning: This post is data-heavy but still full of heart!
We don’t usually focus on numbers when sharing about NatureConnect’s work, but today is an exception! For those who love data, this post dives into how we use it to create impact and foster equity in outdoor education.
When NatureConnect (then the Children’s Forest) started in 2011, we had the ambitious goal of reaching every child in Central Oregon. For a little NatureConnect 101 – we are network – and we’ve always strived to work collectively to create a more equitable outdoors. As our work initially focused on school programs, we started collecting regional data about who our network of partners was reaching in 2012.
This data collection process includes partners like High Desert Museum, Camp Tamarack, Upper Deschutes Watershed Council, Discover Your Forest, and others – sharing data annually about the schools, grades, and teachers they are working with. Our team then works to analyze that data and create a snapshot of engagement across Central Oregon in school-based outdoor education programs (i.e. field trips, classroom visits, etc.). In 2018, we took this a step further and started to disaggregate the data based on race/ethnicity and free and reduced lunch status (based on school demographic data for that year). The disaggregated data gives us a better view of how equitably we are serving students across different demographics.
Each year, our Program Committee, made up of educators from our network of partners, reviews this data to inform how we outreach to schools that year. For NatureConnect, we identify the schools that have the lowest participation rates and work to get information to their teachers about all that is available to them to support outdoor learning. For partners who are offering programs, some might do specific outreach to “low-user” schools, others may save spots for Title I schools, and others might use the data to structure their scholarship programs. Regardless, as a committee our goal is to work towards equitable access across demographics, communities, and schools.
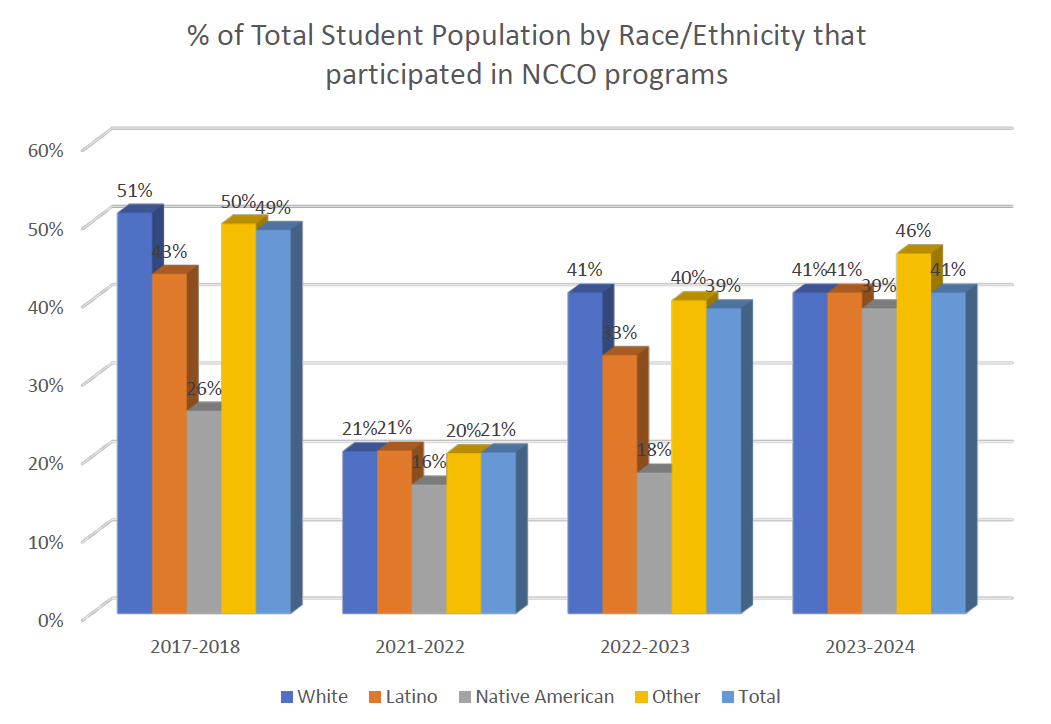
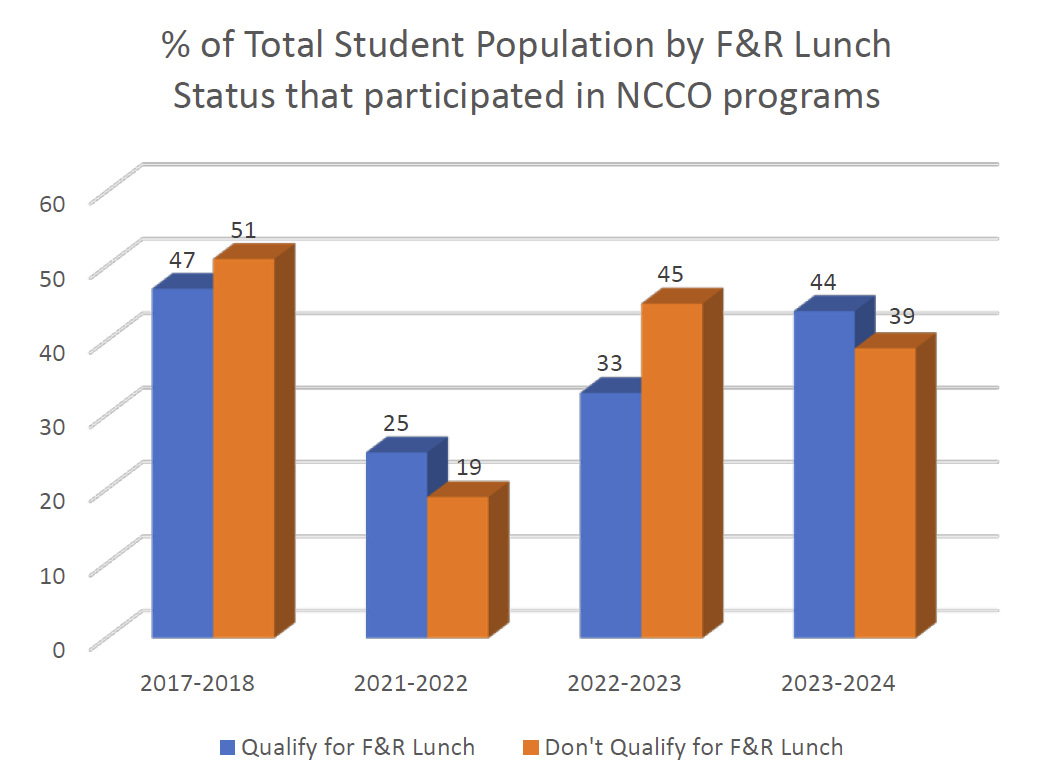
With that history shared, we have some exciting news to share! For the first time since we started gathering this data, we are seeing nearly equitable access across race/ethnicity and free and reduced lunch status. The bar graph below shows the trends over time, comparing 2017-2018 (the peak year for participation numbers) with the last 3 years. Last year, participation rates for outdoor programs were equal for white and Latino students (41%), slightly lower for Native American students (39%), and higher for other races/ethnicities combined (46%). Students who qualify for free and reduced lunch are more likely (44%) to have participated in outdoor education programs than students who don’t qualify for free and reduced lunch (39%).


We want to share a few notes about this data. First, it is based on school demographic data, rather tracking demographic data for every single participant in every single program, so isn’t 100% accurate, but a very close estimate. Next, it doesn’t include private schools, which generally don’t have demographic data publically available (1,691 students reached in 2023-2024, or 11.3% of total reach). Lastly, while we do track the number of days of outdoor programs that a class participates in each year, we don’t disaggregate the data by participation days (only if they participated in a program or not). This is an important next step for us.
Another very important thing to note about what you are seeing with this data is that overall participation numbers are down from their peak in 2017-2018. The total number of students reached is down 11.6% and the number of student days is down 3.6%. Why is this happening? And, why are we still celebrating if we’re not reaching as many students as we were a few years ago? Outdoor learning got hit hard during the pandemic as schools really focused on their basic systems and there just wasn’t enough capacity for off-site activities. Many of the partners who offered programs made cuts and are still building back. So while we feel the community is on it’s way to bouncing back to participation numbers that we saw pre-pandemic, we know that it will take continued work and resources to see continued growth. We also want to recognize that there are many versions of success – and having more equitable participation in outdoor education is as worthy of celebration as higher numbers overall.
While this story doesn’t have the traditional “warm and fuzzy” moments, for NatureConnect, it feels like a huge milestone for our region. It means that overall, your participation in these amazing outdoor learning experiences isn’t skewed because of your race or your socioeconomic status. How we got here has felt like a thousand small steps over the past decade towards a simple goal…making the outdoors accessible for every kid.
